This guide explains how to navigate and edit departments within your operational budget, including the various factor methods available for different account types.
Getting Started
- Navigate to Operational Budgets 2.0
- Open the budget you’d like to edit by clicking "View"
- By default you will land on the Room Revenue Tab
- Click the Departments Tab
- Optional: You can edit your in-line comparisons by selecting the filter at the top left of the page to help guide your budget or remove them completely.
- Last Years Actuals
- Last Years Budget
Page Layout & Navigation
The departments page is organized to show one department at a time and the it’s associated chart of accounts. The table layout is the same as our operating statement or a typical P&L.
- Department Navigation:There are 2 ways to navigate between departments
- Use the left and right arrows to cycle through departments
- Click the department name to get a dropdown of all the departments and select which one to view

Editing Chart of Accounts
To modify any chart of account:
- Click on the row you want to edit
- This will open the factor method slide-out. You can make your edits here.
Factor Method Options
Factor methods are calculations used to edit your chart of accounts. The Factor Method slide-out provides 8 different calculation methods tailored to the hospitality industry to help you find the perfect fit for each type of expense or revenue.
Changing Factor Method
You can change your factor method for any chart of account using the drop down at the top of the slide-out.
Types of Factor Methods
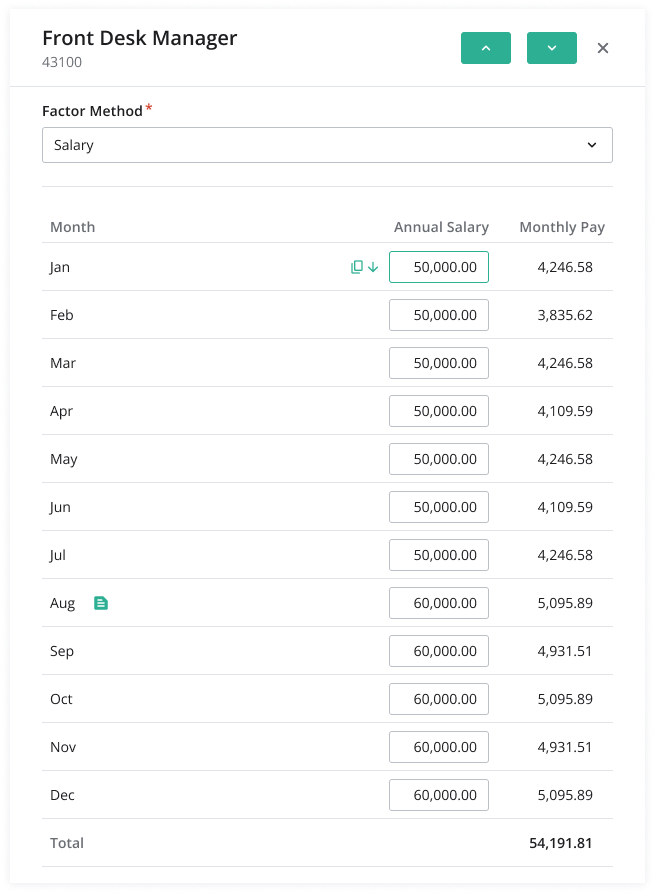
1. Salary
Best for: Fixed salary positions, management roles, administrative staff
How it works:
- Enter salary amounts for each individual month
- Copy Function: If the salary is consistent across months, enter it once and use the copy button (located left of the input field) to duplicate across all the months below.
- Monthly Notes: Add specific notes for individual months to track changes, bonuses, or special circumstances
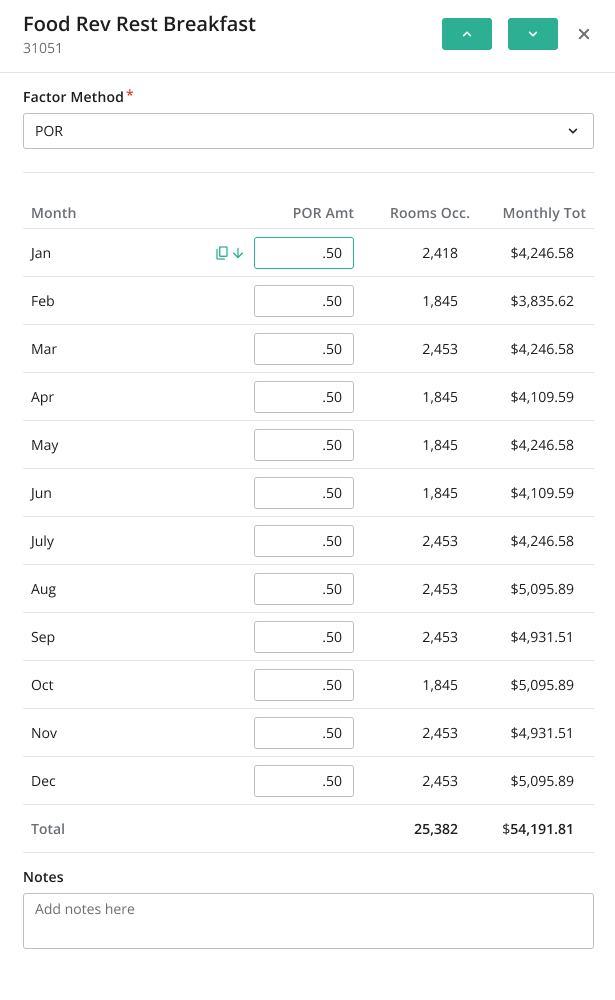
2. Per Occupied Room (POR)
Best for: Expenses that vary directly with occupancy (housekeeping supplies, guest amenities, linens)
How it works:
- Enter POR amounts for each individual month
- Copy Function: If the value is consistent across months, enter it once and use the copy button (located left of the input field) to duplicate across all the months below.
- Notes: Add specific notes, add details or track changes.
3. Percent Of...
Best for: Expenses calculated as a percentage of revenue or another account (commissions, management fees)
How it works:
- Select the chart of account(s) you want this specific chart of account to drive off of.
- Next enter the percentage amount for each month that will come from the selected COAs above
- For example:
- You can drive your OTA Fees expense as a percentage of the sales for the OTA segmentation.
- Copy Function: If the value is consistent across months, enter it once and use the copy button (located left of the input field) to duplicate across all the months below.
- Notes: Add specific notes, add details or track changes.

4. Per Available Room (PAR)
Best for: Fixed costs distributed across total room inventory regardless of occupancy (property taxes, insurance)
How it works:
- Enter PAR amounts for each individual month
- Copy Function: If the value is consistent across months, enter it once and use the copy button (located left of the input field) to duplicate across all the months below.
- Notes: Add specific notes, add details or track changes.

5. Hourly Wage - Minutes Per Occupied Room
Best for: Hourly labor that varies with occupied rooms (housekeeping time, room service)
How it works:
- Enter the hourly rate amounts for each individual month
- Enter the Minutes POR amount for each individual month
- Copy Function: If the value is consistent across months, enter it once and use the copy button (located left of the input field) to duplicate across all the months below.
- Notes: Add specific notes, add details or track changes.

6. Hourly Wage By Day of Week
Best for: Hourly positions with different staffing patterns throughout the week (front desk, maintenance, security)
How it works:
- Select a time frame (this defaults to the entire year 01/01 to 12/31)
- You can split time frames and have different rates and hours for those time frames
- Enter the hourly rate amount for each individual day of the week
- Enter the number of hours for each individual day of the week
- Copy Function: If the value is consistent across months, enter it once and use the copy button (located left of the input field) to duplicate across all the months below.
- Notes: Add specific notes, add details or track changes.
- Timeframe Summary: Each time frame you create has its own accordion with a monthly summary from your inputs.
- Total Summary: At the top of the slide-out there is an accordion to show you the breakdown across the entire year from your timeframes and inputs.

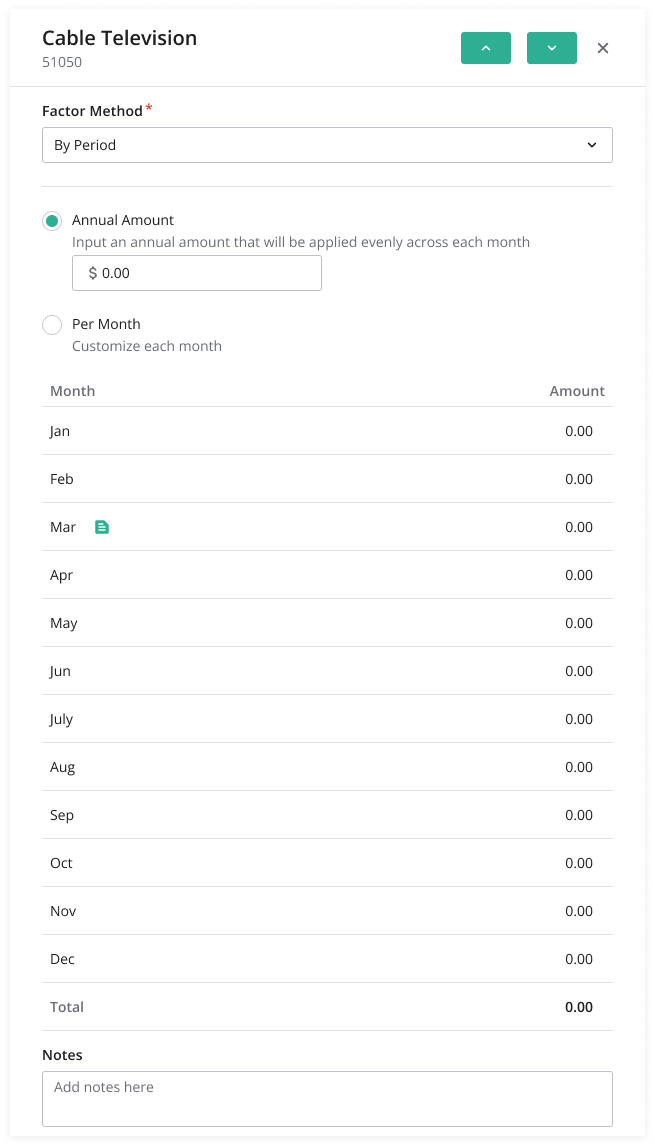
7. By Period
Best for: Expenses that occur at specific times or have seasonal variations (TV, Internet, software)
How it works:
- Select an input type:
- Annual Amount: Input an total annual amount and we will apply it evenly across each month.
- Per Month: Customize each month individually
- Copy Function (for per month): If the value is consistent across months, enter it once and use the copy button (located left of the input field) to duplicate across all the months below.
- Monthly Notes: Add specific notes for individual months to capture details or track changes.
8. By Day of Week
Best for: Expenses that vary based on day-of-week patterns (weekend premium labor, daily contracted services)
How it works:
- Select a time frame (this defaults to the entire year 01/01 to 12/31)
- You can split time frames and have different rates and hours for those time frames
- Enter the amount for each individual day of the week
- Copy Function: If the value is consistent across months, enter it once and use the copy button (located left of the input field) to duplicate across all the months below.
- Notes: Add specific notes, add details or track changes.
- Timeframe Summary: Each time frame you create has it’s own accordion with a monthly summary from your inputs.
- Total Summary: At the top of the slide-out there is an accordion to show you the breakdown across the entire year from your timeframes and inputs.

Best Practices
- Choose the Right Method: Select the factor method that best matches how the expense actually behaves in your operation
- Use Notes: Document your assumptions for future reference and budget reviews
- Leverage Copy Function: Save time by copying consistent values rather than entering each month individually
- Leverage the Row Switcher: In the factor method slide-out there are arrows to jump to the next row within the header
- Review Dependencies: Remember that some methods rely on your room revenue projections being accurate
Was this article helpful?
That’s Great!
Thank you for your feedback
Sorry! We couldn't be helpful
Thank you for your feedback
Feedback sent
We appreciate your effort and will try to fix the article